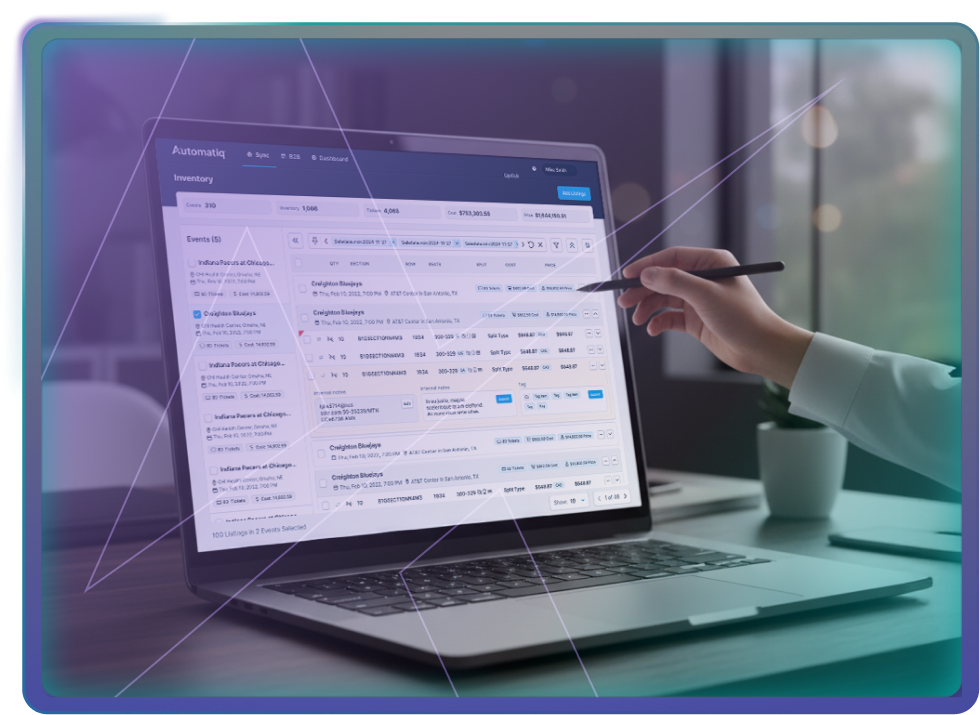
Every PSL, every seat, every listing — tracked, valued, and ready to move. Cost basis on every ticket, market value pulled live, and hold-or-sell calls when you need them. Built around the way you actually run your operation.


For whom
Everyone else thinks like a broker — buy cheap, list fast, move inventory. We built frankstickets.com for the operators who measure their book the way a fund manager measures a portfolio.
You bought season tickets across two leagues last year and you're already drowning in tabs. frankstickets centralizes every seat, tracks cost basis, and tells you when each ticket becomes more valuable held than sold.
See how individuals scaleManage multiple sub-portfolios under one parent. Tenant-level isolation, role-based access for analysts and partners, and consolidated NAV reporting on the full book without leaking positions between desks.
See the multi-tenant modelPlug your inventory feed into the frankstickets distribution layer and let our pricing engine reach four marketplaces from a single API. You keep the buyer relationship; we keep your fills above market.
See API distributionPlatform
Five modules, one source of truth. Pick the tab — every part of the platform speaks the same investor language.
Every ticket arrives with its cost basis, holding period, and acquisition channel attached. No more guessing what you paid or scrolling through eight months of credit card statements at tax time.
The model watches demand, comparable seats, opponent strength, weather, and time to event — then writes new price points across every connected marketplace. You set the floor; we find the ceiling.
Each position runs through a Monte Carlo simulation against historical comps, opponent variance, and demand-curve momentum. The result is a recommendation, a confidence band, and the math behind it.
One inventory edit propagates to every marketplace you trust. No more double-listing, no more pulled-but-still-live nightmares.
Every position, every fill, every override — fully attributed. Daily P&L statements, season-over-season cohort views, and the receipts to back every move.
Why frankstickets
The category leader thinks in turn rate. We think in compound return. Three things make frankstickets different from everything else in your stack.
We start from the book — cost basis, holding period, expected return — not from a marketplace upload form. Every tool downstream inherits that framing.
A dashboard tells you what happened. frankstickets tells you whether to hold or sell each seat — with the simulation, confidence band, and override trail to back it.
Built for funds, not just operators. Per-tenant credential vaults, role-based access, consolidated NAV reporting — without a single position leaking between desks.
The category leader thinks like a broker — buy cheap, list fast, move inventory. We think like an investor — cost basis, ROI projection, hold-or-sell math. Same market. Completely different operating system.
Private beta is open to operators holding $50K+ in season-ticket cost basis. Drop your email — we'll route you to onboarding within 48 hours.
No credit card. No sales call. Investor-grade onboarding only.